In this tutorial, you will learn about Spring Boot Actuator. You will also see how it helps to monitor and manage your application seamlessly.
Overview
The actuator is a monitoring function provided by the Spring Boot framework. The actuator works by exposing endpoints that can be used to monitor the internal conditions of the Spring Boot application, such as automatic configuration, spring beans information, health metrics, obtaining the current application properties values, threads information etc.
In the following sections, you will learn how to enable the Spring Boot actuator in your application.
Preparation:
- JDK 1.8
- Intellij Idea for IDE
- Maven
- SpringBoot Application
- Lombok plugin
Creating a Basic Spring Boot Application
Firstly, we create a simple Spring Boot web application. You can use the Spring Initializr page to create an initial project template.
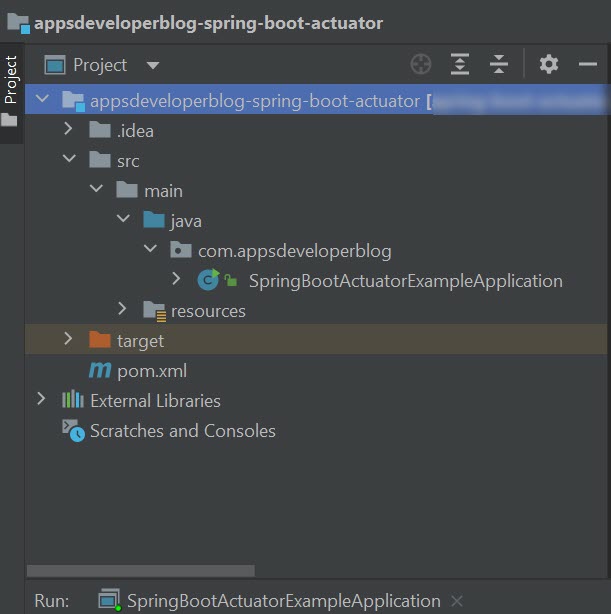
Once you import the project into IDE, the final project structure will look like this:
Include Actuator Dependency
To include Spring Boot Actuator to your Spring Boot project, add the following Maven dependency:
<dependency>
    <groupID>org.springframework.boot</groupID>
    <artifactID>spring-boot-starter-actuator</artifactID>
</dependency>
<?xml version="1.0" encoding="UTF-8"?>
<project xmlns="http://maven.apache.org/POM/4.0.0" xmlns:xsi="http://www.w3.org/2001/XMLSchema-instance" xsi:schemaLocation="http://maven.apache.org/POM/4.0.0 https://maven.apache.org/xsd/maven-4.0.0.xsd">
    <modelVersion>4.0.0</modelVersion>
    <parent>
        <groupId>org.springframework.boot</groupId>
        <artifactId>spring-boot-starter-parent</artifactId>
        <version>2.5.0</version>
        <relativePath/>
    </parent>
    <groupId>com.appsdeveloperblog</groupId>
    <artifactId>spring-boot-actuator</artifactId>
    <version>0.0.1-SNAPSHOT</version>
    <packaging>jar</packaging>
    <name>springboot-actuator-example</name>
    <description>Spring boot actuator tutorial</description>

    <properties>
        <project.build.sourceEncoding>UTF-8</project.build.sourceEncoding>
        <project.reporting.outputEncoding>UTF-8</project.reporting.outputEncoding>
        <java.version>1.8</java.version>
    </properties>
    <dependencies>
        <dependency>
            <groupId>org.springframework.boot</groupId>
            <artifactId>spring-boot-starter-actuator</artifactId>
        </dependency>
        <dependency>
            <groupId>org.springframework.boot</groupId>
            <artifactId>spring-boot-starter-web</artifactId>
        </dependency>
    </dependencies>
    <build>
        <plugins>
            <plugin>
                <groupId>org.springframework.boot</groupId>
                <artifactId>spring-boot-maven-plugin</artifactId>
            </plugin>
        </plugins>
    </build>
</project>
Actuator Health Endpoint
Once Maven dependency for the actuator is included, you can already start using some of its API endpoints. By default, only the following endpoint is enabled at runtime due to security reasons:
- /health – allows us to check whether the Microservice is running. It is widely used in monitoring the running instances of microservices.
Let’s see this endpoint in action.
First, we will compile and run our Spring Boot application using Maven commands.
mvn clean package
mvn spring-boot:run
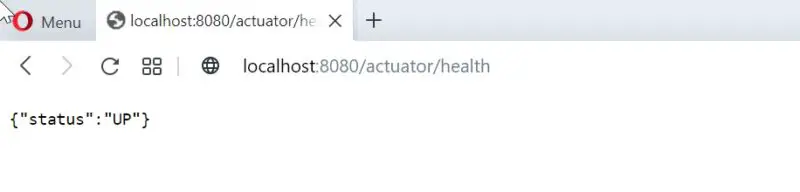
Once the application starts successfully, you can open the following URL in the browser window:
http://localhost:8080/actuator/health
As you can see, the application status is displayed as “UP” which means the app runs successfully.
Actuator Info Endpoint
The /actuator/info API endpoint is provided by Spring Boot Actuator and it allows you to expose arbitrary application information, such as build details or environment-specific configurations. You can customize the response by providing a properties file, a YAML file or even a JSON file. This endpoint can be helpful in providing additional metadata about your application that can be consumed by other services or monitoring tools.
Enable & Expose /info API Endpoint
It is possible that the /actuator/info API endpoint is not enabled or exposed in your application. To enable and expose the /info API endpoint over HTTP, add the following two properties to your application.properties file.
management.info.env.enabled=true
management.endpoints.web.exposure.include=health,info
Configure Application Information
Once the “/actuator/info” API endpoint is enabled in a Spring Boot application, you can configure it to expose custom application-specific information by defining a properties file, YAML file, or even a JSON file in the classpath. This allows you to add additional metadata about your application, such as build information, environment-specific configurations, or any other relevant information that might be helpful for monitoring or managing your application.
Please note that each configuration property starts with info.*:
info.application.name=AppsDeveloper Blog demo
info.application.description=A demo for Spring Boot Actuator
info.application.author.name=Sharad Dixit
info.application.author.bio=Software Developer
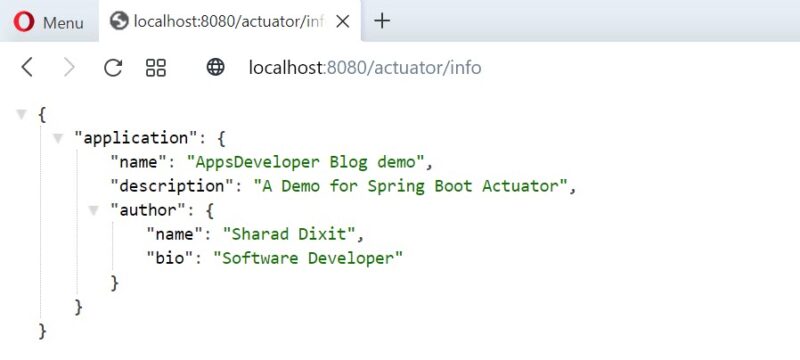
After compiling and re-running our application again. If we navigate to the following actuator URL in the browser:
http://localhost:8080/actuator/info
the browser will expose the application info as below:
Enabling Hidden Endpoints
In addition to the above two actuators, Spring allows us to activate another series of actuators that are already predefined. In order to activate the rest of the actuators endpoints, we have to go to our application.properties file and modify the following property and set it with the asterisk value as below:
management.endpoints.web.exposure.include = *
This property will expose all pre-defined lists of actuators. Although, this is not a good idea when your microservice is in production. Instead, we should choose specific endpoints to display.
Here, several methods are possible, but the easiest is to include only those that interest us in the property as below:
management.endpoints.web.exposure.include=health,info,metrics
With this property, only these endpoints are exposed.
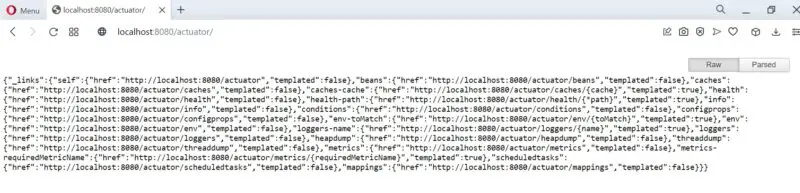
Now, if we navigate to the following URL
http://localhost:8080/actuator/
Spring will display the list of exposed actuators provided by spring based on the property set. For example, if the property “management.endpoints.web.exposure.include” is marked as *.
Below is the basic description of the most common actuator endpoints:
| ID | explanation | Initial Value |
|---|---|---|
| autoconfig | Shows all auto-config definitions | true |
| beans | Shows all beans managed by Spring. | true |
| dump | Provides thread dump details for each thread | true |
| env | Shows Spring’s ConfigurableEnvironment values. | true |
| health | Displays application health. | false |
| info | Shows application information. | false |
| loggers | Shows the log information used in the application. | true |
| mappings | The @RequestMapping definition shows the values made. | true |
| trace | Lists the 100 most recently used HTTP requests. | true
|
You can read in full detail about each endpoint in the official documentation here.
Custom Actuator Endpoints
It is also possible to create custom endpoints based on individual requests. For example, if we want to create a dedicated endpoint in our application that shows the “Change-Log” for our application on each release. This can be achieved easily in Spring Boot Version 2 using @Endpoint annotation.
Next, we will create a class called “CustomActuator.java” in our package, which will be annotated with @Component annotation to create a Spring-managed component. In this class, we will create a custom endpoint using @Endpoint annotation. Later via @ReadOperation (maps to HTTP GET), we read the response.
The complete code for CustomActuator.java is as follows:
package com.appsdeveloperblog;

import org.springframework.boot.actuate.endpoint.annotation.Endpoint;
import org.springframework.boot.actuate.endpoint.annotation.ReadOperation;
import org.springframework.stereotype.Component;

@Component
@Endpoint(id="change-logs")
public class CustomActuator {

    String changelog = "** version 2.0 ** \n\n"
            + "* Improved performance \n"
            + "* removed bug fix with local-id \n"
            + "* Added support of SAML authentication \n";

    @ReadOperation
    public String changeLogs() {
        return changelog;
    }
}
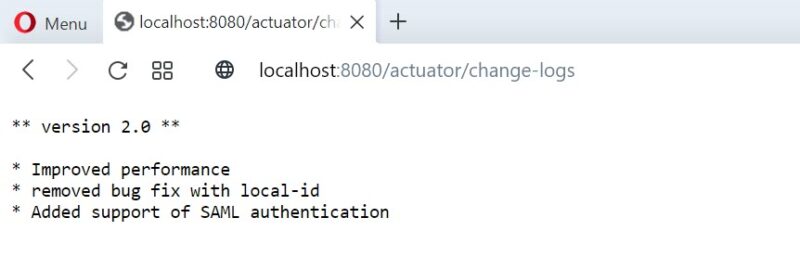
now if we run our application and navigate to our custom endpoint
http://localhost:8080/actuator/change-logs
After that, it will display my change log details:
Conclusion
In this tutorial, we learned how to use Spring Boot Actuator to check the status and metrics of your system. This helps developers to monitor the internals of Microservices. For example, health matrix, environment variables, performance, threads information etc., in the simplest way.
To learn more, check out the Spring Cloud Microservices tutorials page.