In this tutorial, you will learn the basic fundamentals of Elasticsearch, Logstash, and Kibana ( ELK stack ). Additionally, you will learn how to set up the environment locally.
Overview
Observability is important in the world of DevOps. We mean by observability three things mainly:
- Monitoring
- Centralization of logs
- Tracing
With the growth of microservices and server data, logging has become increasingly important. It is very essential in diagnosing and resolving problems in order to run the app properly. Taking hours to search for certain information among so many files, is like looking for a needle in a haystack. With ELK you can search, analyze and visualize data more easily in 100% customizable information boards, it can also efficiently handle large amounts of data without having to worry about its scalability.
What is ELK Stack?
Elastic Stack – formerly known as ELK Stack – is an open-source software collection produced by Elastic as a company that allows you to search, analyze, and view logs generated from any source in any which format, a practice known as centralized logging. Centralized logging can be useful when trying to identify issues with your servers or applications because it allows you to view all of your logs in one place. It is also useful because it allows you to identify issues that affect multiple servers, correlating their logs for a specific time period.
The Elastic Stack has four main components:
- Elasticsearch: A distributed RESTful search engine that stores all collected data.
- Logstash: The data processing component of Elastic Stack, which sends incoming data to Elasticsearch.
- Kibana: a web interface for searching and viewing newspapers.
- Beats: Lightweight, single-use data senders that can send data from hundreds or thousands of machines to Logstash or Elasticsearch.
In the next section, you will learn how to set up Elastic Stack on your local machine.
Installation of the ELK stack
Over time, things got a lot easier when it came to installing ELK. The quickest way to run the ELK stack is via docker containers using the docker-compose file.
Docker Compose is a popular Docker Orchestration tool for sharing work environments in teams, allowing developers not to have to deal with server settings or dependencies that require them just by running with Docker Compose pre-configured files. You can learn more about docker-compose from the following tutorial “Spring Boot Microservices Deployment with Docker Compose“.
Prerequisites
The only requirement to run any docker-compose file is to have the docker service up and running in the system.
Initial Configuration
First of all, we will create a docker-compose.yaml. Below is the complete source code for docker-compose.yaml file
version: '3'
services:
  elasticsearch:
    image: elasticsearch:6.8.20
    ports:
      - "9200:9200"
  logstash:
    image: logstash:6.8.20
    command: -f /etc/logstash/conf.d/
    volumes:
      - ./logstash.d:/etc/logstash/conf.d
    depends_on:
        - elasticsearch
    ports:
      - "5000:5000"
  kibana:
    image: kibana:6.8.20
    depends_on:
        - elasticsearch
    ports:
      - "5601:5601"
Let’s understand this docker-compose file in detail:
We have declared three services as below:
- Elasticsearch;
- Logstash;
- Kibana;
Each service will be responsible for creating individual containers using dedicated images, for example, elasticsearch:6.8.20 refers elasticsearch image in docker registry etc.
Also, each container exposes the port to interact with the external world. For example, the Kibana container is exposed via the port 5601 in order for you to reach the dashboard. The Kibana container will automatically try to connect to elasticsearch at the host address http://localhost:9200.
The final part, the logstash container. It’s the process that will collect the containers logs to aggregate them and push them to Elasticsearch.
If you wish to provide extra configuration files to Logstash, put them in the conf.d/ directory, making sure they end in .conf.
Run the setup
To bring the stack, make sure you are in the same directory as the docker-compose.yaml file and run:
docker-compose up
This will run up three containers in the foreground. To background them so you can have your terminal back run:
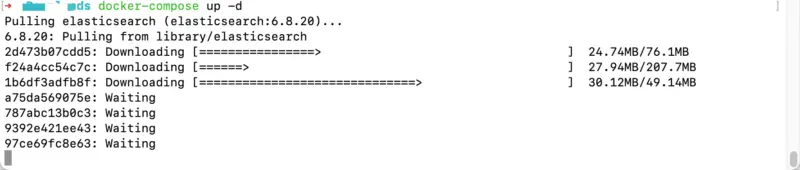
docker-compose up -d
This will start all the containers in the background. Also, in output you see that docker is downloading all the images in local system.
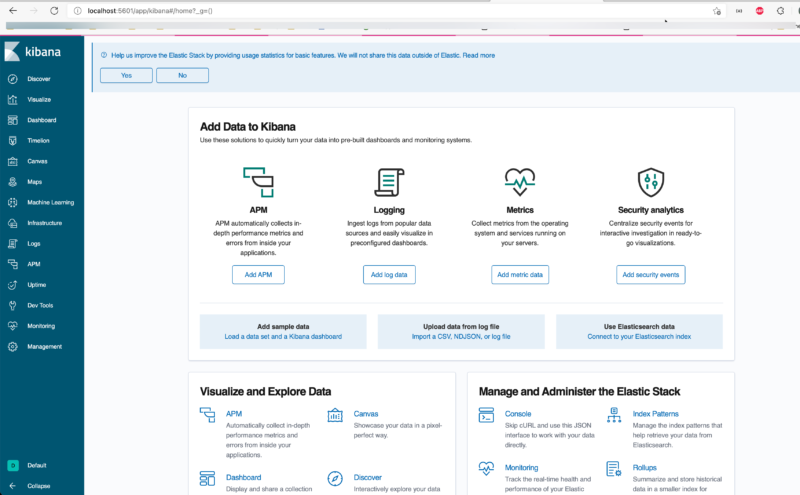
If the command is successful, you should be able to see the Kibana console on http://localhost:5601 on your web browser as below.
For Elasticsearch, if you navigate to URL http://localhost:9200 then browser should present output similar to below screen .
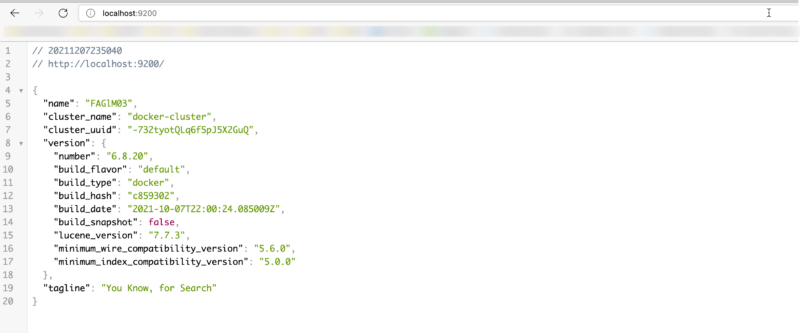
If you get both screens, congratulations, you have successfully overcome your biggest obstacle to learning the elk stack! Your ELK stack is up and running successfully.
Additionally, if you want to view the logs for the services then the following command can be used.
docker-compose logs
Also, if you need to uninstall the ELK stack, just use the following command for Docker Compose.
docker-compose down -v
Conclusion
The ELK Stack has millions of users globally due to its effectiveness in log administration. In this tutorial, you learned how to install and run Elastic Stack (ELK) stack easily on any platform using Docker irrespective of the operating system. In the current scope, we have only targeted basic setup, but not on the pipeline, advanced Logstash, and Elasticsearch configurations.
I hope you liked it!